Live validator monitoring
Track validator state, duties, rewards and active issues from one desktop view.
ObserveMonitor validator performance, isolate node-level issues, track BeaconScore, rewards and infrastructure health — in a focused desktop workflow built for operators.
Track validator state, duties, rewards and active issues from one desktop view.
ObserveUnderstand validator efficiency through a duty-aware performance layer, not just raw events.
IsolateBreak problems down by node, server or client and keep machine health close to validator outcomes.
ActBeaconcha Tools removes explorer noise and turns validator data into a focused operating workflow for daily monitoring, diagnostics and action.
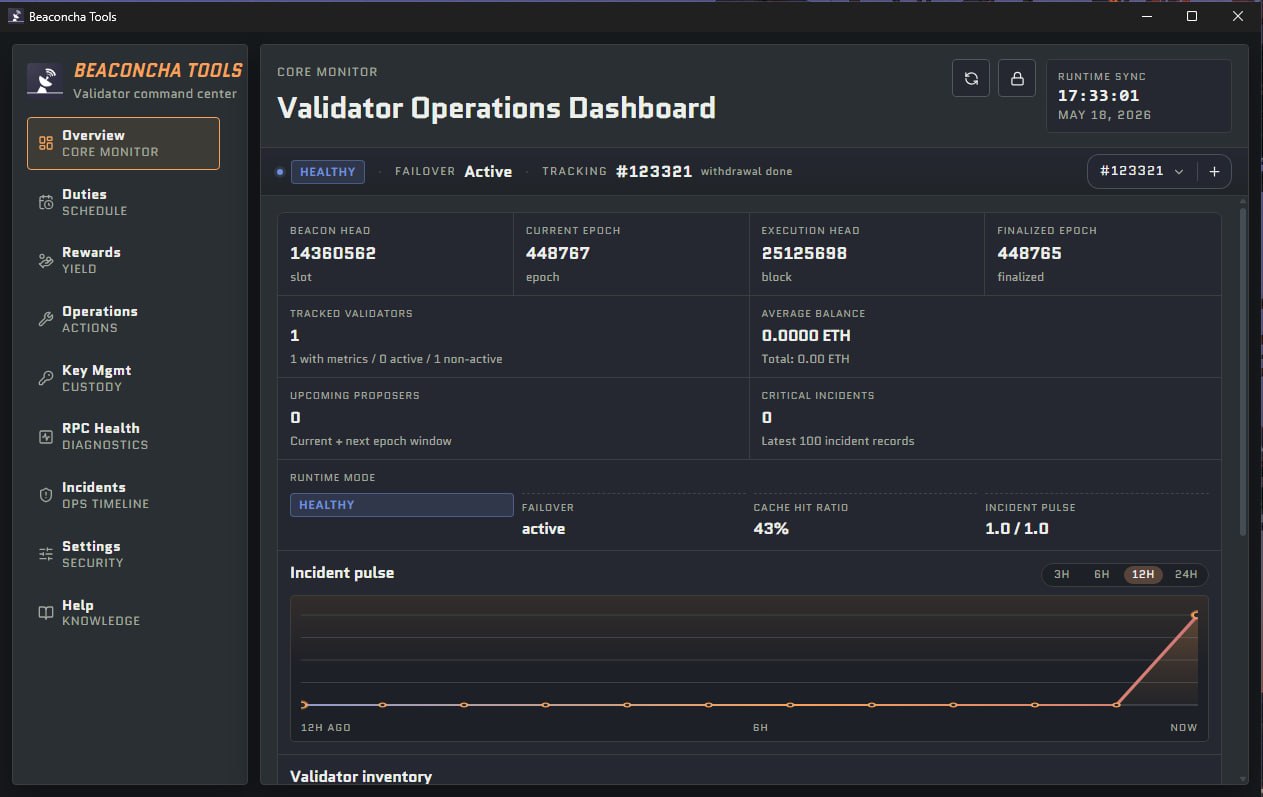
Keep validator groups, BeaconScore, duties, alerts and infrastructure health visible in one desktop workspace instead of stitching together explorer pages, node context and ad-hoc monitoring surfaces.
The major clients stay inside the same desktop surface for monitoring, diagnostics and day-to-day validator work.






The monitoring context Beaconcha users already know, pulled into a tighter desktop flow for diagnostics, review and daily action.
Primary desktop build for focused validator monitoring, diagnostics and daily operator workflows.
SHA-256 checksumsa17326e39f32c46ac5e3a1802843ac0ec223f8c3a6ee79bf7a0ee2ef3f201779
Built for operators running validator infrastructure in Linux-based environments and server-adjacent workflows.
SHA-256 checksums0ef3d4a60805231e2e81d809f6bd899a6b8ec472539831346405608e4d303386
In development. The current release focus stays on Windows and Linux desktop workflows.
The practical questions operators usually need answered before installing and using Beaconcha Tools.
Windows and Linux are available now. macOS is still in development.
The current compatibility section includes Lighthouse, Prysm, Nimbus, Teku, Lodestar and Nethermind.
The app is built for validator state, duties, rewards, BeaconScore signals, alerts and infrastructure-aware monitoring.
Yes. The product is positioned around diagnostics, grouping and infrastructure context so operators can break issues down by node, server or client.
It is designed as a desktop operations surface for focused monitoring, diagnostics and daily validator workflows rather than a passive browser dashboard.
Yes. The interface is built to keep validator groups, performance signals, alerts and machine-level context visible in one desktop workspace.
Yes. The product is presented as part of the Beaconcha ecosystem and brings Beaconcha-style monitoring context into a tighter desktop workflow.
Use the official Beaconcha documentation, GitHub repository and product updates linked in the downloads support area.